
Mutual Funds in Canada
Their Types And How to Invest in Them


What You Should Know
- A mutual fund is a managed fund that pools money from different investors and invests in stocks, bonds, and other assets.
- Mutual funds provide access to professional investment expertise and cost-effective diversification for retail investors.
- Mutual funds usually come with management fees that may considerably lower expected ROI over time.
- Mutual Funds are similar to Exchange-Traded Funds (ETFs), which tend to have lower fees and fewer trading restrictions.
What Is a Mutual Fund?
A mutual fund is an investment pool managed by an investment team. It allows investors to purchase a diversified investment managed by a team of financial professionals. An investor buys mutual fund shares directly from the fund, which comes with certain restrictions and fees. This process differs from buying stocks and ETFs that can be traded freely on an exchange.
Mutual funds are often categorized by the type of assets they hold. They can be categorized as money market, bond, equity, and balanced funds. Nowadays, it is possible to find mutual funds that invest in less conventional assets such as cryptocurrency. Every fund category can be further divided based on its income strategy, as a fund might seek income in the form of interest, dividend, capital gain, or a combination of the two. The pie chart below shows the assets under management (AUM) for Mutual Funds in Canada as of November 2023.
Assets Under Management for Mutual Funds in Canada
Source: The Investment Funds Institute of Canada. Data for November 2023.
Many financial institutions provide mutual funds. Fidelity, Vanguard, and BlackRock are the most famous mutual fund issuers. TD, RBC, and BMO are some of the most famous Canadian mutual fund issuers. Around 140 issuers have provided approximately 4,000 funds in Canada. The Investment Funds Institute of Canada (IFIC) represents these issuers.
Major Canadian Banks and Mutual Funds
Most Canadian banks have a wealth-management or an asset-management subsidiary that sponsors mutual funds. This means that major Canadian banks are among the top issuers offering a range of mutual funds.
Types of Mutual Funds
Money Market Funds
Money market funds buy investment grade short maturity (typically less than 90 days) debt securities. Money market funds entail minimal risk, and their returns are expected to be slightly higher than the Bank of Canada rate. As a result, money market funds can substitute savings accounts.
Bond Funds
Bond funds buy bonds with maturities typically longer than 90 days. Bond funds are as diverse as the bond market itself. A bond funds prospectus might limit the fund manager to government bonds, investment grade corporate bonds, or below investment grade (junk) bonds, or it might give the fund manager a free hand to choose bonds offering the best risk-reward ratio. It is important to understand the risk level of a mutual fund before investing in them.
Equity Funds
Equity mutual funds invest in stocks. Equity funds take on a much more significant risk than money market and bond mutual funds and are expected to provide higher returns. The risk of a particular fund is determined in the prospectus of that fund. It is important to clearly understand the fund's objectives to avoid taking on unnecessary risk.
Balanced Mutual Funds
Balanced mutual funds, also known as hybrid mutual funds, often have investment strategies that are more complex than the other types of mutual funds. For example, they might combine stocks and bonds to achieve the highest return for a particular level of risk. Or they might change the combination of their assets over time to start with a high-return portfolio and gain a low-risk portfolio by a target date. It is common for a hybrid mutual fund to be structured as a fund of funds. A fund of funds is a fund that invests in other mutual funds of the same or different asset classes.
Specialty Mutual Funds
Any mutual fund that does not fit the definition of conventional funds is called a specialty mutual fund. These mutual funds may track a certain sector of the economy or invest in other asset classes such as currencies, commodities, real estate, and cryptocurrencies. Specialty mutual funds usually have a specific goal and may not be as diversified as other mutual funds.
Mutual Fund Fees
Mutual funds have various fees that can considerably lower the return on investment over time. These fees are one of the largest downsides of mutual funds and should be considered when choosing mutual funds over other investments. The following list provides the common fees mutual fund investors face.
Management Expense Ratio (MER)
A mutual fund incurs a lot of different expenses including marketing expenses, salaries for the fund's board of directors (or board of trustees), the fund manager, and their support staff would be a significant sum. In addition, satisfying regulatory requirements for a fund, including accounting and bookkeeping would add on top of the operating expenses. When the fund buys or sells securities, it has to pay commissions. Lastly, the fund issuer needs to make some profit.
For all these items and other costs of a fund not mentioned here, the fund issuer would take a portion of the total assets of the fund on a daily basis. The annualized portion of the assets the issuer takes is reported as the management expense ratio (MER). The fund issuer takes this money regardless of the fund's performance.
Expense Ratios of Canadian Mutual Funds
Mutual fund expense ratios (MER) in Canada can be as low as 0.05% or as high as 3.4%. Generally, the best mutual funds in Canada have low MER and consistent returns over the years.
Load
Load is a common term for sales commission. Not all mutual funds would charge a load; those that demand a load might charge it when you purchase units of the fund or when you dispose of them. A front-end load refers to the fund fees assessed and charged at the time of investing in the mutual fund. A back-end load refers to the fund fees that are assessed and charged at the time of withdrawal of money from the mutual fund. If a mutual fund doesn’t charge these fees, it is called a no-load mutual fund.
Other Trading Fees
If you ask your broker to buy or sell units of a mutual fund, they might charge you a fee for this service. This fee differs from broker to broker and can be significant if you make a small purchase. This fee can be minimized or avoided if you purchase from the mutual fund issuer directly. Mutual funds may also charge you a fee or a penalty for early withdrawal or selling the holdings before a certain time.
Active vs. Passive Mutual Funds
In an active mutual fund, the fund manager selects the stocks and bonds the fund purchases, while a passive mutual fund outsources this task to its index provider. Generally, passive mutual funds that follow an index, like S&P TSX Composite Index, boost a much lower MER than actively managed funds. The expense ratio of passive mutual funds is lower than active funds because passive funds require less overhead to run the fund.
Mutual Fund Structures

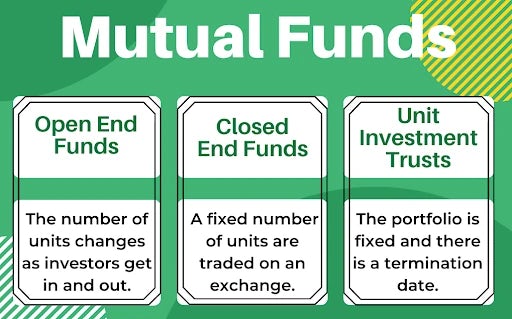
Mutual funds can be categorized into three distinct structures. These structures refer to how they operate, how new and current investors can buy and sell their shares and whether there is a termination date for the fund.
Open-End Mutual Fund
Open-end funds are the most common type of mutual fund. In an open-end fund, an investor would invest in the fund directly with the issuer at the net asset value (NAV). NAV is the sum of all fund’s assets minus all of its liabilities divided by the number of shares issued by the fund. If the fund holds any illiquid assets, calculating NAV might become controversial. The method for calculating NAV must be detailed in the fund’s prospectus. Later, the investor would sell units of the fund at their NAV (at the end of the trading day when the sale order is issued) to the fund issuer.
Closed-End Mutual Fund
A Closed-end fund, also called a non-redeemable investment fund, is offered to investors directly at the fund's inception and then listed on an exchange. Investors can trade units of the fund with each other, but they cannot be sold directly to the issuer. Units' prices are determined by supply and demand. Fund units might trade at a premium or a discount to their NAV. Closed-end mutual funds resemble exchange-traded funds (ETFs) in many respects.
Unit Investment Trust
Unit investment trusts created for a specific investment purpose for a particular period of time are another possible structure for mutual funds. They usually have a termination date when the trust is liquidated, and the holders receive the remaining funds. Unit investment trusts are bought and sold directly with the fund issuer.
How to Invest in Mutual Funds
It is simple to invest in a mutual fund because most banks and brokers in Canada offer certain mutual fund investment opportunities. The following steps can guide you through investing in mutual funds.
- Get a brokerage account with access to mutual funds. You may have a brokerage account with your bank or a trading platform that offers mutual funds.
- Pick the mutual funds you want to invest in. You should look for available mutual funds on the platform you use. If you plan to invest a large amount of money through your bank, you can contact your bank and see if they can help you pick the funds that align with your financial goals.
- Understand the fees and commitments of investment in the chosen mutual fund. Once you understand the mutual fund’s policies, you have to decide how much money to invest in the fund.
- Invest in the mutual fund with the platform or a broker you use. It can be as simple as making a “Buy” order on your phone.
- You can track the performance of your investment or not pay attention to it until you can withdraw your investment without incurring any penalties.
- Once you want to sell your investment, you should do it with the platform or the broker you use. It can be as simple as sending a “Sell” order on your phone.
Pros and Cons of Mutual Funds
Mutual funds have many reasons that make them attractive investments for many people. Some of the most important reasons are diversification and professional management. On the other hand, cons such as high fees and commitment requirements should make an investor consider alternatives to the mutual fund.
| Advantages | Disadvantages |
|---|---|
| Diversification | High Fees & Commissions |
| Professional Management | Restrictions on Funds Withdrawal |
| Large Number of Funds to Choose From | No Performance Guarantee |
| Different Asset Classes Offered | Lack of Transparency Compared to Other Assets |
Mutual Fund Alphabet Soup
Stock classes are often associated with the number of votes associated with each share. In the case of mutual funds, class, often referred to as series, relates to the number and type of fees charged.
Mutual funds have different distribution channels, and each channel has its associated costs. This means that the same fund often has different series. All series have the same underlying assets with the same proportions but differ in how you acquire them and their costs.
The following list briefly explains what the letter series means in Canada. The US mutual funds have different definitions for the letters.
I-Series: I stands for institutional. Mutual Fund issuers charge a smaller management fee on their I series but require a much more significant minimum investment. However, TD mutual funds consider I to stand for “investor series” and offer the I series to its retail investors.
O-Series: Some issuers like TD use the letter O for their fund’s institutional series, which are no-load funds with relatively high minimum investment.
E-Series: Some issuers use the letter E for their retail series that are no-load funds. They have a relatively low minimum investment but a higher expense ratio.
D-Series: D series is used to target self-directed investors.
A-Series: Advisor series of funds are often distributed through investment advisors. They usually pay a trailing commission to the advisor or broker who sold them. The trailing commission is often 1% for equity or balanced funds and 0.5% for bond funds. This commission naturally results in a higher management expense ratio.
F-Series: The letter F stands for “fee-based.” They are designed for situations where the customer pays a fee to their advisor, and the fund is not needed to compensate the advisor. Advisor fees are typically in the range of 1% to 1.5% annually of the assets in the account the advisor is managing.
T-Series: These series include funds with large fixed distributions. Their distribution is so large they often include part of your initial investment.
In the US, the alphabet soup meaning is quite different. A series funds often face a sales commission called a front-end load. Class A shares often face lower marketing and distribution costs and have several breakpoints. B shares often have a deferred sales charge called a back-end load. These shares are suitable for long-term investors as the sales charge will be paid after you liquidate your investment, and you get to keep the compounding growth for your sales charge. Class C shares generally have no front-end load and a modest back-end load (typically 1%) if redeemed in a period shorter than a threshold (typically a year).
Disclaimer:
- Any analysis or commentary reflects the opinions of WOWA.ca analysts and should not be considered financial advice. Please consult a licensed professional before making any decisions.
- The calculators and content on this page are for general information only. WOWA® does not guarantee the accuracy and is not responsible for any consequences of using the calculator.
- Financial institutions and brokerages may compensate us for connecting customers to them through payments for advertisements, clicks, and leads.
- Interest rates are sourced from financial institutions' websites or provided to us directly. Real estate data is sourced from the Canadian Real Estate Association (CREA) and regional boards' websites and documents.