


💰 The Value of Money is Being Diluted Continuously; But By How Much?
📉 CPI vs. Asset Returns in Canada (Past 40 Years)
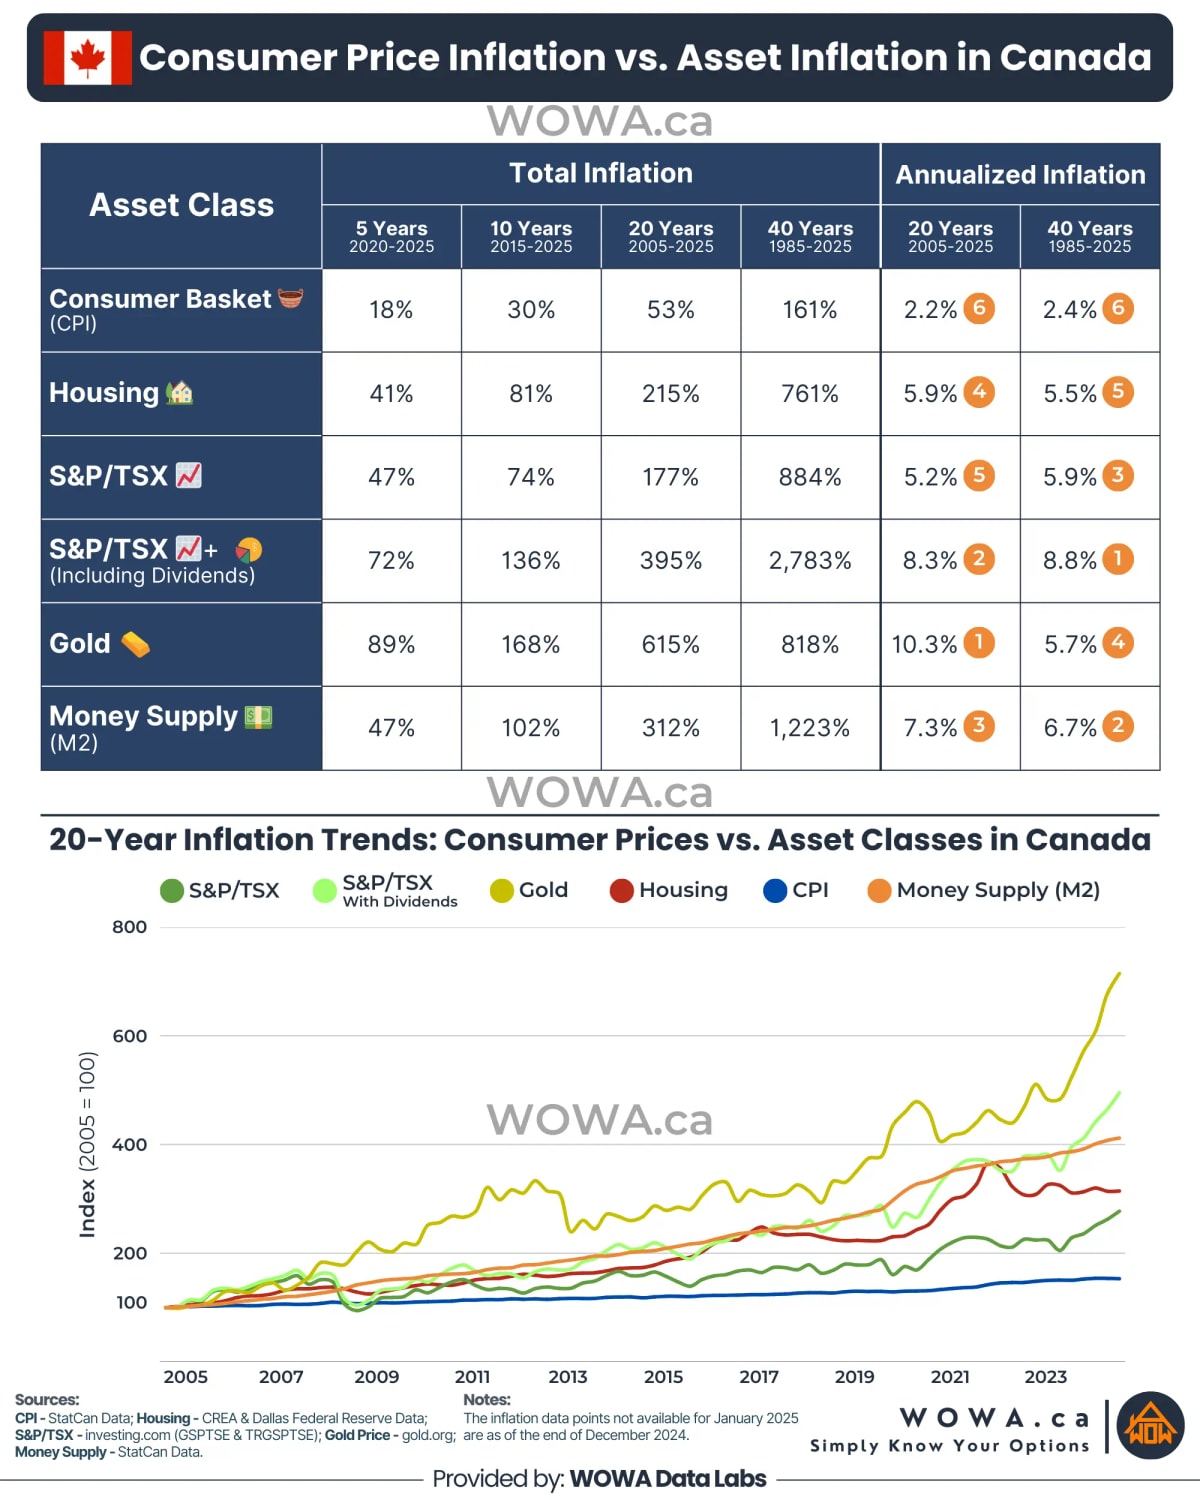
| Basket ▲ | 5-Year Inflation | 10-Year Inflation | 20-Year Inflation | 40-Year Inflation | 20-Year Annualized | 40-Year Annualized |
|---|---|---|---|---|---|---|
| Consumer Basket (CPI) | 18% | 30% | 53% | 161% | 2.2% | 2.4% |
| Housing | 41% | 81% | 215% | 761% | 5.9% | 5.5% |
| S&P/TSX | 47% | 74% | 177% | 884% | 5.2% | 5.9% |
| S&P/TSX (Including Dividends) | 72% | 136% | 395% | 2783% | 8.3% | 8.8% |
| Gold | 89% | 168% | 615% | 818% | 10.3% | 5.7% |
| Money Supply (M2) | 47% | 102% | 312% | 1223% | 7.3% | 6.7% |
With the increasing money supply, the value of money continues to erode. Here’s how $1,000 in 2005 would have performed across different asset classes:
📈 $1000 Asset Returns (2005-2025):
- 1️⃣ $7,150 if invested in Gold
- 2️⃣ $4,950 if invested in a TSX Index (with reinvested dividends)
- 3️⃣ $3,150 if invested in real estate (excluding rent)
- 4️⃣ $1,530 if adjusted for CPI (consumer goods purchasing power)
🔹 Excluding CPI, all other returns align with the 312% growth in money supply (M2) over the same period.
🔹 Note: GDP growth during this period was only 131%.
The Trick They Don’t Tell You…
Discussions on money devaluation typically focus on CPI, but technology offsets some real inflation in consumer goods. For example, in 1985, producing 2kg of chicken took far more resources than today.
💡 Perhaps asset inflation is a better measure of true money devaluation than CPI.
📊 Key Takeaways:
- 1️⃣ Money is being diluted as M2 has grown 312% in 20 years and 1,223% in 40 years.
- 2️⃣ M2 exponential growth is influenced by both Bank of Canada policy (M0) and commercial banking activity. A surge in government debt often incentivizes the BoC to expand M0.
- 3️⃣ Loose monetary policy and rising government debt inflate asset prices, favoring asset holders and widening wealth inequality.
🏦 The continuous increase in money supply favors asset holders over cash savers.

Follow us on social media for more posts
Disclaimer:
- Any analysis or commentary reflects the opinions of WOWA.ca analysts and should not be considered financial advice. Please consult a licensed professional before making any decisions.
- The calculators and content on this page are for general information only. WOWA® does not guarantee the accuracy and is not responsible for any consequences of using the calculator.
- Financial institutions and brokerages may compensate us for connecting customers to them through payments for advertisements, clicks, and leads.
- Interest rates are sourced from financial institutions' websites or provided to us directly. Real estate data is sourced from the Canadian Real Estate Association (CREA) and regional boards' websites and documents.