
What Does "Days on Market (DOM)" Mean in Real Estate?


What You Should Know
- Days on Market (DOM) is a statistic to measure how long a property is listed before it's either sold or taken off the market.
- You can compare neighbourhoods and properties with the DOM statistic.
- You can predict real estate prices with regional DOM trends.
- Regions with low DOM favour sellers. High DOM regions favour buyers.
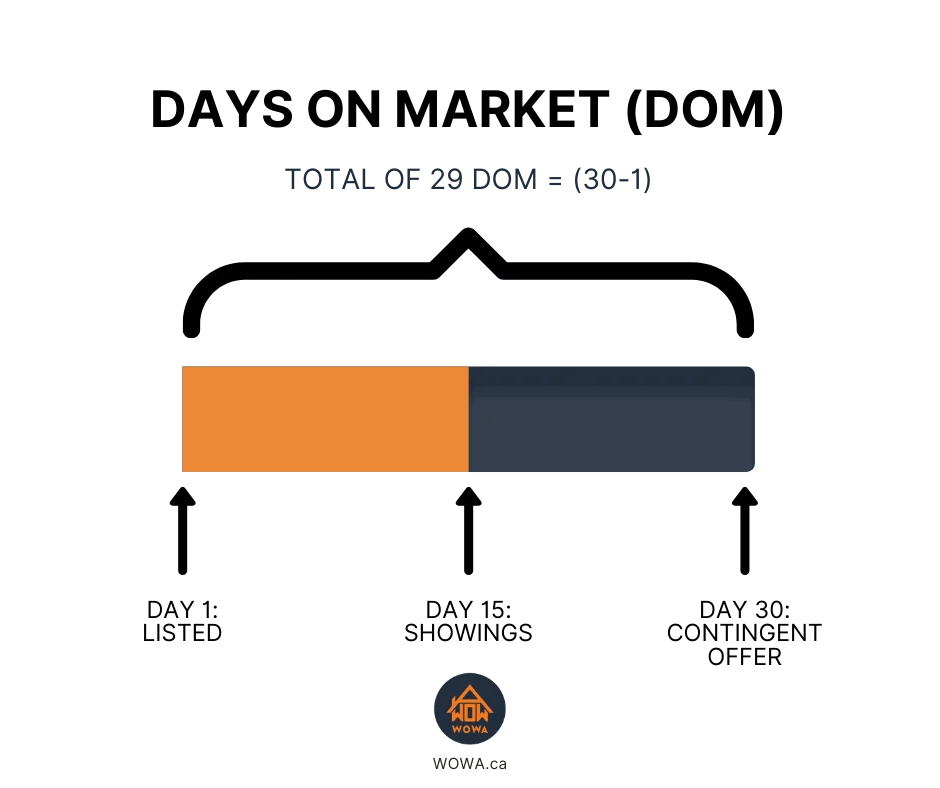
Days on Market or "DOM" is a crucial statistic used to understand real estate activity in a particular area. DOM measures the number of days between a property's initial listing and the date it either sold or was taken off the market. A decreasing DOM means a market becomes more competitive, while the opposite is true with an increasing DOM. It is used to compare locations and also to predict trends.
What Does DOM Mean?

DOM is a statistic used to measure how many days a property takes to sell or be taken off the market. It can be applied to a singular house or averaged to a region.
When comparing two neighbourhoods, a higher DOM tells you houses take longer on average to sell in that area. The houses could take longer to sell because of undesirable features such as high prices, being too far from amenities, an unfavourable school district, or a cold market.
Lower DOM neighbourhoods tell you houses are selling quickly and the market is competitive. Buyers are rushing to purchase a home and are likely making offers with fewer contingencies.
You can also use DOM to compare a property with its neighbourhood. For example, if a property takes longer to sell than the neighbourhood average, it could signal reevaluating the price using comparative market analysis.
It is worth noting that the DOM resets for a specific property each time it's re-listed. Real estate agents may re-list a property after it has been on the market for a long time. This is because the high DOM could discourage buyers. The cumulative days on market (CDOM) statistic solves this issue and is explained later.
Toronto Real Estate Average DOM (Days on the Market) 2016-2026
How to Analyze DOM to Predict Future Real Estate Trends
DOM is also useful for spotting trends and making predictions over time. If the average DOM in an area rises year over year, listing prices tend to grow more slowly than in the surrounding region — sellers adjust their prices downward to stay competitive and attract buyers faster.
That said, real estate prices generally rise over time, so a climbing DOM won't cause prices to fall outright. It just means a neighbourhood is appreciating more slowly than its neighbours.
The reverse holds in areas where DOM is shrinking. Demand is outpacing supply, sellers have the upper hand, and prices tend to rise faster than the regional average.
DOM can also help you time a sale. Sellers benefit most when DOM is low — competition is high and bidding wars are more likely. Buyers, on the other hand, get more leverage when DOM is high and inventory is sitting. If your area's DOM historically dips in spring, that's your window to list.
While DOM thresholds vary by city and price range, the table below outlines the general benchmarks used by real estate professionals across Canada.
| Average DOM | Market Type | What It Means | Buyer Strategy | Seller Strategy |
|---|---|---|---|---|
| 0–15 days | Very Hot Market | Homes sell extremely quickly; strong demand and frequent bidding wars | Move fast, offer competitively, minimize conditions | List confidently; consider pricing slightly below market to attract multiple offers |
| 15–30 days | Hot Market | Strong demand; most homes sell at or above asking | Be prepared to compete; limited negotiation power | Price at market value; expect a quick sale |
| 30–45 days | Balanced Market | Supply and demand are relatively even | Compare listings carefully; moderate negotiation possible | Price accurately; marketing and staging matter |
| 45–60 days | Soft Market | Homes take longer to sell; buyers have more options | Negotiate on price and conditions | Consider pricing slightly below comps; improve presentation |
| 60+ days | Buyer's Market | Weak demand; high inventory; slow sales | Strong negotiating power; offer below asking | Price aggressively; expect a longer selling timeline |
Note: In major markets like Toronto or Vancouver, even 20–25 days may indicate a slower market, while smaller markets typically have a higher average DOM.
How Does DOM Affect Buyers?
Buyers need to look at DOM to understand how competitive a neighbourhood is. Neighbourhoods with a low and decreasing DOM are competitive, so the buyer will need to make a favourable offer. Buyers should also ensure to quickly receive home insurance quotes to close on the property fast. An experienced real estate agent would advise the buyer to increase the offer price or reduce conditions in the purchase agreement.
Additionally, buyers can compare the DOM of a particular listing with the neighbourhood average when making an offer. If the listing's DOM far exceeds the neighbourhood average, then you can assume the sellers don't have many offers. The buyer can leverage this information to negotiate a better deal.
How Does DOM Affect Sellers?
DOM also affects the pricing strategy for real estate sellers. If a neighbourhood's average DOM is consistently decreasing, it could be worthwhile for the seller to delay listing the property. If the trend continues, the property could be listed in a more competitive market with a higher chance of a bidding war.
However, if the neighbourhood DOM is increasing, then it's better to sell now. An increasing DOM makes it difficult for sellers to show their homes. This is because homeowners have to compete with other sellers to find buyers. Sellers will need to pay attention to every aspect of marketing their home, from staging it properly to advertising in multiple online platforms or publications.
How is DOM Different From CDOM?
Days on Market (DOM) is different from Cumulative Days on Market (CDOM) because DOM is reset each time a property is re-listed. As a result, real estate agents can manipulate the DOM statistic to make an unsold property appear more attractive. This is why it's essential to cross-reference with CDOM, which isn't reset with each re-listing.
For example; imagine a property initially listed in January but doesn't receive any offers so is removed from the market in April. If this property were re-listed in May and sold in June, then the statistics would appear as:
- DOM: 2 Months (May - June)
- CDOM: 6 Months (January - April, May - June)
DOM can typically be found on any listing website, but CDOM is usually only available through MLS. Buyers can see it through their real estate agent. Although neither statistic is better than the other, they help paint an accurate representation of the listing.
How to Use DOM When Making an Offer?
In competitive, low-DOM markets, buyers may shorten or waive conditions such as home inspections to make their offers more attractive.
In contrast, when a property has a high DOM, buyers are typically able to include full conditions and negotiate more favourable terms.
FAQ
How do you calculate DOM and CDOM?
DOMDOM is calculated by subtracting the day a house was first listed from the date it closed. If it closed today, you would take today's date and subtract the day that it was first listed.
It can be written as follows: Date House Sold or Taken Off Market - Date House First Listed = DOM days.
CDOMCDOM is not reset each time a property is relisted; it is a cumulative statistic. If a property were taken off the market and relisted, CDOM would continue from the previous DOM. Each real estate board calculates CDOM differently. Typically, a property must be relisted in a 30-90 day period for CDOM to count it.
Do luxury homes usually have a higher DOM?
Yes, the high prices reduce the number of qualified buyers, so it takes longer for a sale to happen. However, many luxury sellers use a pocket listing which keeps the DOM statistic private.
What are the benefits of knowing DOM stats for investment properties?
DOM is beneficial for investment properties because it helps agents determine negotiation leverage. Sellers have more power in deals with a lower expected DOM because there will be more buyer competition.
Do safer neighbourhoods always have a lower DOM?
No, they can vary for different areas. It all depends on the demand of the location and what is available to buy in that area.
Why is DOM higher for a specific property
A few factors can cause a higher DOM. Initially, the listing price could be too high, preventing offers. It could also be that the house isn't advertised well. Finally, unique and niche properties have a smaller pool of interested buyers, so they tend to be for sale longer.
Disclaimer:
- Any analysis or commentary reflects the opinions of WOWA.ca analysts and should not be considered financial advice. Please consult a licensed professional before making any decisions.
- The calculators and content on this page are for general information only. WOWA® does not guarantee the accuracy and is not responsible for any consequences of using the calculator.
- Financial institutions and brokerages may compensate us for connecting customers to them through payments for advertisements, clicks, and leads.
- Interest rates are sourced from financial institutions' websites or provided to us directly. Real estate data is sourced from the Canadian Real Estate Association (CREA) and regional boards' websites and documents.