
Canadian Housing Market Report


*Seasonally Adjusted
Note: Data sourced from the Canadian Real Estate Association (CREA)
Canadian Housing Market Data for March 2024


Canada Real Estate Market Trends
Note: *Transactions are seasonally-adjusted
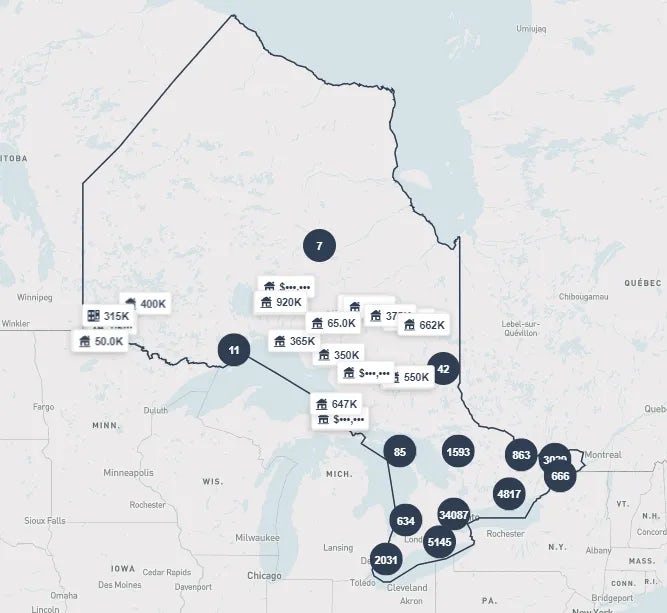
Average Home Prices by Province (March 2024)
Provincial Average Home Sale Prices
Canada
Canadian home prices increased in March 2024, as the national benchmark home price increased by 1.3% monthly and 0.7% annually to reach $729,700. Canada is experiencing an unprecedented level of home unaffordability, as home prices have risen by 38% over the past 5 years and 86% over the past 10 years, while CPI inflation was respectively 18% and 28% over the past 5 and 10 years. Meanwhile, the average Canadian home price was $698,530 in March 2024, a 1.9% monthly increase and up 1.8% year-over-year.
Nationally, there were 38,963 home sales, seasonally-adjusted, during the month of March 2024, a seasonally-adjusted 6.4% decrease year-over-year, yet it is up 1.3% compared to last month’s 38,454 sales in February 2024.
Benchmark Home Prices by Province (March 2024)
| Province | March 2024 Benchmark Home Price | Monthly Change (%) | Annual Change (%) |
|---|---|---|---|
| British Columbia | $976,400 | 1.1% | 4.0% |
| Ontario | $882,600 | 1.7% | 0.2% |
| Alberta | $507,900 | 2.4% | 9.8% |
| Quebec | $480,700 | 2.0% | 4.8% |
| Nova Scotia | $402,200 | 0.9% | 4.8% |
| PEI | $356,500 | 2.1% | 5.5% |
| Saskatchewan | $334,500 | 1.1% | 3.9% |
| New Brunswick | $295,900 | 3.2% | 9.5% |
| Newfoundland | $290,400 | 0.8% | 6.7% |
Benchmark Prices Across Canada
For March 2024, benchmark home prices in the Canadian housing market and all provincial housing markets increased both on a monthly basis and on a yearly basis, with the exception of PEI, which instead saw a slight monthly decrease in benchmark prices. The latest data on benchmark home prices across Canadian provinces shows that British Columbia continues to lead the pack with a benchmark home price of $976,400, followed by Ontario, where the benchmark home price was $882,600 in March 2024, while the province with the lowest benchmark price was Newfoundland and Labrador, at $290,400.
Canada: Seller’s or Buyer’s Markets?
| Province | March 2024 Sales-to-New-Listings Ratio (SNLR) | February 2024 Sales-to-New-Listings Ratio (SNLR) | Change | Market Type |
|---|---|---|---|---|
| Alberta | 73.7% | 72.1% | Seller's Market | |
| Saskatchewan | 62.6% | 67.4% | Seller's Market | |
| Manitoba | 64.8% | 52.1% | Seller's Market | |
| Ontario | 49.6% | 51.5% | Balanced Market | |
| Quebec | 66.9% | 59.7% | Seller's Market | |
| Nova Scotia | 65.9% | 69.7% | Seller's Market | |
| New Brunswick | 62.4% | 65.2% | Seller's Market | |
| Newfoundland | 47.2% | 51.3% | Balanced Market | |
| PEI | 49.7% | 58.4% | Balanced Market | |
| Canada | 57.4% | 55.6% | Balanced Market |
SNLR
For the month of March 2024, Canada’s sales-to-new-listings ratio (SNLR) was 57.4%. The current 57.4% SNLR signals a balanced market. In a balanced market, sellers receive reasonable offers for their homes. At the same time, buyers have enough options to view and choose from. Most of Canada's provincial housing markets are currently in a seller’s market territory.
The Sales-to-New-Listings Ratio (SNLR) is an important indicator that helps understand the balance between the demand and supply in the housing market. A high SNLR above 60% suggests a seller's market, indicating that buyers have very limited options to choose from. Conversely, a low SNLR below 40% would indicate a buyer's market, where sellers cannot receive reasonable offers for their homes over a reasonable amount of time.
Today’s Mortgage Rates
| 1-Year Fixed | 2-Year Fixed | 3-Year Fixed | 4-Year Fixed | 5-Year Fixed | 5-Year Variable | |
|---|---|---|---|---|---|---|
| Lowest Rates | 6.39% | 5.44% | 4.79% | 4.89% | 4.69% | 5.9% |
| Average Rates (10 Lenders) | 7.4% | 6.74% | 6.04% | 5.91% | 5.51% | 6.8% |
| 30-Days Change of Average Rates | -1 bps lower | -1 bps lower | -2 bps lower | -1 bps lower | -4 bps lower | -3 bps lower |
| Term | Lowest Rates | Average Rates (10 Lenders) | 30-Days Change of Average Rates |
|---|---|---|---|
| 1-Year Fixed | 6.39% | 7.4% | -1 bps lower |
| 2-Year Fixed | 5.44% | 6.74% | -1 bps lower |
| 3-Year Fixed | 4.79% | 6.04% | -2 bps lower |
| 4-Year Fixed | 4.89% | 5.91% | -1 bps lower |
| 5-Year Fixed | 4.69% | 5.51% | -4 bps lower |
| 5-Year Variable | 5.9% | 6.8% | -3 bps lower |
The basket of 10 lenders includes: CIBC, BMO, TD, Scotiabank, RBC, National Bank, Desjardins, nesto, Tangerine, First National


*Prior to March 2024, HSBC Canada was included in the basket
Ontario
Home prices in Ontario's housing market rose during March 2024, with Ontario's benchmark home price increasing by 1.7% compared to February 2024 to $882,600 and Ontario’s average home price rising by 1.8% from February 2024 to $889,033. On an annual basis, Ontario benchmark home prices are up just 0.2%, while the average home price is up 0.8% year-over-year.


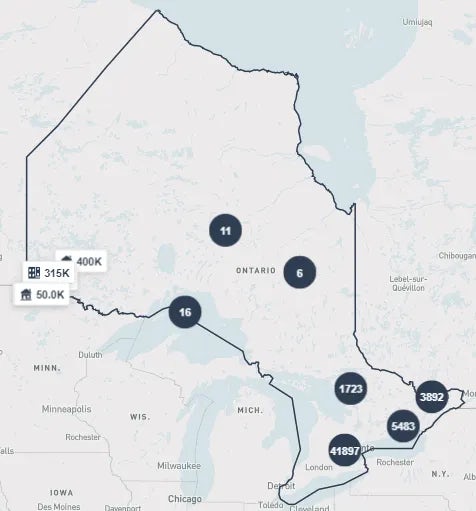
Ontario continues to have one of the highest average home prices across the provinces, second only to British Columbia.
The average home sold price in the GTA was $1,121,615 in March 2024, representing an increase of 1.2% year over year and 1.2% month over month. Meanwhile, the GTA’s benchmark home price is up 1.8% monthly.
GTA home sales are up 17% year-over-year, with 6560 transactions in March. The GTA's SNLR was 50%, almost the same as the province’s 49.6%.
When it comes to the housing market in Ontario, let's take a closer look at some interesting trends. Mississauga’s housing market had a strong March 2024, with Mississauga’s average home price increasing 6.0% in one month to $1,056,300. That’s up by 1.9% year-over-year.
Neighbouring Brampton’s housing market saw its average home price decrease by 0.5% from last month to $1,028,297. In Hamilton's housing market home prices are up 6.2% monthly to $826,462, while in Ottawa, home prices are up 4.7% monthly at $682,078.
Kitchener-Waterloo Region has seen prices increase 6.7% monthly to $806,279. Oshawa home prices are down 2.1% monthly to $802,843.
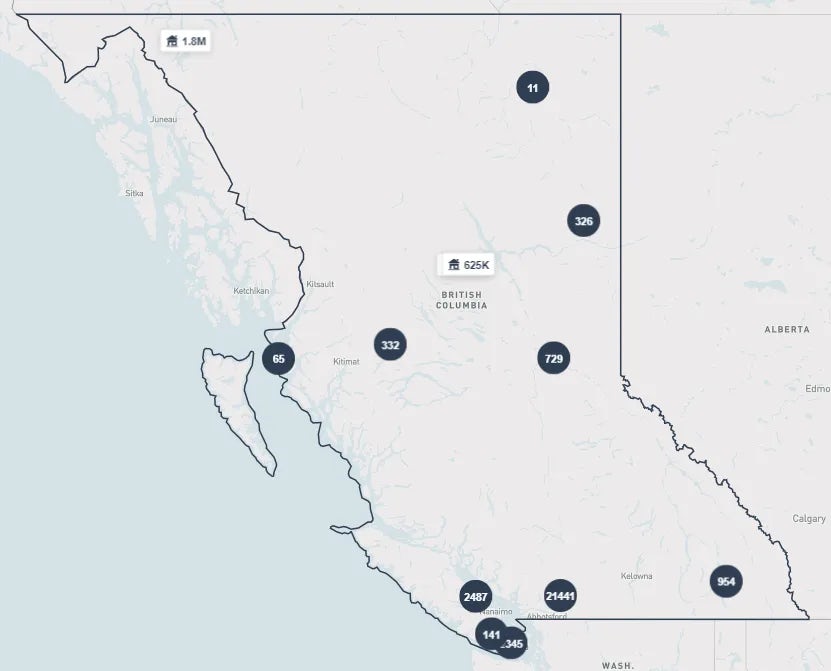
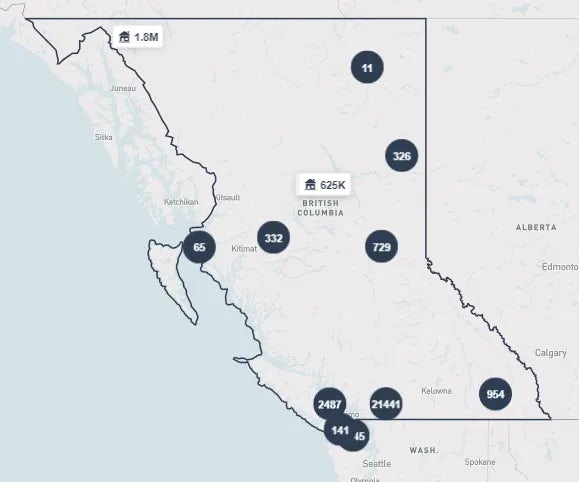
British Columbia
British Columbia maintained its position as the province with the highest average home price in March 2024, with BC’s average home price up 6.1% year-over-year while increasing 3.3% compared to last month, at $1,020,000. 6,460 BC home sales are up 17.5% month-over-month and down by 9.5% year-over-year.
Greater Vancouver's average home price for March 2024 was $1,318,687, up 4.1% year-over-year. This makes Vancouver the most expensive city in Canada to buy a home in.


Quebec
Quebec's average home price has increased by 8.6% year over year, one of the strongest gains in the country. For March 2024, Quebec’s average home price was $490,230, which is also up by 2.2% monthly. Alternatively, Quebec’s benchmark home price of $480,700 is up 2% monthly and 4.8% annually.
The Montreal housing market saw average prices rise 8% annually and increase 2.7% monthly to an average price of $595,132 for March 2024. Quebec City’s average home price of $388,922 has instead risen by 2.2% monthly and 8.5% annually.
Atlantic Canada
Home prices in Atlantic Canada are seeing some mixed movements. Nova Scotia saw a 9.7% increase year-on-year in average prices, with an average home price of $443,771, also prices are up 4.7% monthly. Nova Scotia’s benchmark home price is up 4.8% year-over-year and up 0.9% month-over-month. Halifax’s average home price of $564,562 in March 2024 is up 4% annually.
In PEI, the average home price of $376,429 is down 5.7% year-over-year, and has decreased by 5% compared to February 2024. 143 PEI home sales are up 10% year-over-year, while PEI’s benchmark home price is up 5.5% year-over-year and is up by 2.1% month-over-month to $356,500.
Meanwhile, Newfoundland's housing market saw a strong year-over-year average price increase of 9%. The average home price for March 2024 in Newfoundland and Labrador is $299,032. On a monthly basis, Newfoundland's home prices are down 3.6%, but 310 Newfoundland's home sales have decreased by 11% compared to last year.
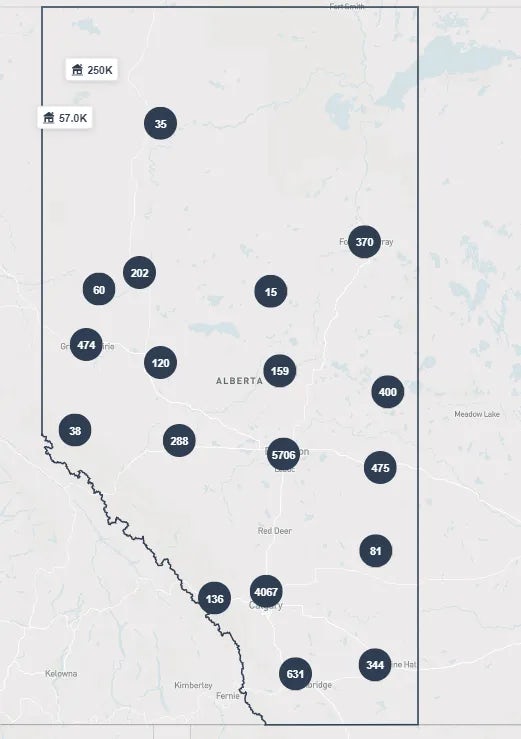
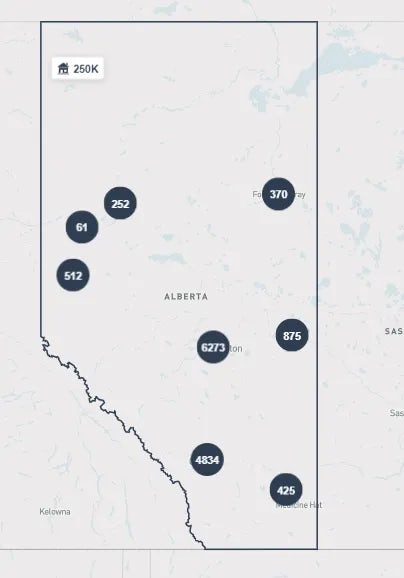
The Prairies
The Prairies region in Canada is heating up as it has become one of the hottest housing markets in Canada in recent months. Alberta stands out with the highest annual increase in benchmark home prices, and the highest annual increase in monthly sales.
For March 2024, Alberta’s average home price was $497,473, up 0.7% annually and up 3.2% monthly. Alberta’s benchmark price of $507,900 is up 9.8% annually and up 2.4% monthly. Alberta home sales are up 18% year-over-year and up 28% compared to February 2024.
Meanwhile, Saskatchewan witnessed a 1% annual decline in average prices yet also experienced a 0.2 decrease on a monthly basis. Among its cities, Saskatoon and Regina showed mixed results, with Saskatoon observing a 5.8% monthly increase and a 2% annual increase to $377,465, while Regina experienced a 7.1% monthly decrease to $294,121. The overall average price in Saskatchewan was $305,490 in March 2024.
Finally, Manitoba showcased a 7.3% annual increase and a 4.6% monthly increase, putting the average price at $362,535. However, Manitoba home sales have risen 7.8% year-over-year to 1,188 home sales in the province, down by 25% from last month.
There’s more persistent growth in Alberta’s urban housing markets, where home prices in Calgary are up 11% year-over-year to $596,193, while Edmonton home prices had a 7.9% annual increase to $420,959. Meanwhile, Winnipeg’s average home price is up 4.5% year-over-year to $375,390.


Breakdown By Region
New Housing Price Index
The New Housing Price Index (NHPI) is a housing price index published by Statistics Canada that measures the change over time in selling prices of new residential properties. It is published by Statistics Canada and used by governmental agencies, market analysts, and real estate businesses. The index is relative to a standard of 100 set in 2017.
Other Real Estate Statistics
Homeownership Rate: 66.5% (2021)
Vacancy Rate: 1.5% (2023)
Housing Construction
Housing Starts: The trend is 244,800 units per year, the actual number of housing starts is 14,878 (January 2024)
Housing Under Construction: 353,361 units (Jan 2024)
Housing Completions: 187,630 units (2023)
Investment in Residential Construction: CAD $157.7 billion (2023)
Investment in Non-Residential Construction: CAD $71.4 billion (2023)
Average Rent for a 2-Bedroom Unit
As reported by the CMHC for purpose-built rentals in 2023
| Region | Average Rent for a 2-Bedroom Unit |
|---|---|
| Greater Toronto Area, ON | $1,940 (8.7%) |
| Ottawa, ON | $1,698 (4%) |
| Vancouver, BC | $2,181 (8.6%) |
| Victoria, BC | $1,839 (7.9%) |
| Quebec City, QC | $1,040 (4.8%) |
| Montreal, QC | $1,096 (7.9%) |
| Edmonton, AB | $1,398 (6.4%) |
| Calgary, AB | $1,695 (14.3%) |
| Winnipeg, MB | $1,427 (4.4%) |
| Saskatoon, SK | $1,360 (9.0%) |
| Halifax, NS | $1,628 (11%) |
Glossary and Definitions
MLS® HPI: The MLS® Home Price Index (HPI) is an index by the Canadian Real Estate Association (CREA) that tracks the prices of homes in a neighborhood. It allows Canadians to quickly compare home prices across Canada and between periods of time without having to account for specific features of a property. Unlike market prices, which can fluctuate from month to month based on seasonal dynamics, the HPI provides a stable view tracks trends across a longer period of time. The HPI is reviewed every year in May to adjust for changes in the real estate marketplace.
MLS® HPI Benchmark Price: The MLS® Home Price Index (HPI) Benchmark Price is the HPI translated into a real-world price number.
Strata Insurance: Strata insurance is insurance used by a strata like a condominium to covers damages to common areas and assets and liability to the strata. It can also include fixtures built or installed as part of the original construction of each unit, even though these may not be common structures. The insurance can cover:
- Buildings and structures associated with the strata including common areas such as the roof, parking garages, driveways, gyms, pools, etc.
- Liability for any property damage or bodily injury suffered on strata property
- Any fixtures that are part of the "standard unit" or original construction of each unit
Strata insurance does not usually include personal items and appliances that are part of a condo unit. It also does not cover the damages made by individual unit owners, such as in the case of water damage caused by a unit owner. These are usually covered by personal condo insurance.
Property types
Detached home: A detached home is your standard single-family home. It is a residential building that stands alone and is separately titled or legally a single unit.
Semi-detached home: A semi-detached home is similar to a detached home, except it shares a wall with another home. This pair of homes must make up an independent building and each should be separately titled or legally two separate units. There can only be two homes in a semi-detached building.
Townhouses: A townhouse is the middle between a detached/semi-detached home and a condo apartment. Like detached and semi-detached homes, they are often single-family units that have their own land and may be attached to other units. However, like condo apartments, they typically have to pay co-ownership fees for maintenance and may share some common features with their neighbors.
Condo apartment: This category includes all apartments and condominiums. These are complexes of residential units with common areas such as hallways, parking lots, stairwells, etc. They can be low-rise, mid-rise, or high-rise buildings. Unlike townhouses, there are no parts of the lot (the land of the building) where access is reserved for only one owner or occupant. There can be privately owned units and spaces inside the building.
Plexes are multi-story buildings with two to four individual units, usually one on each floor. They are a mainstay in Montreal and other cities in Quebec. Each unit is usually individually accessible via an external entrance with higher floors connected by staircases.
Property Classes
Freeholds: A freehold is any property where the owner owns both the house and the land it is built on. Common freehold property types include: detached, semi-detached, some townhouses, and farmland.
Condominiums: A condominium or condo is any property where the owner owns the home (or unit) but shares ownership of the land and other improvements with a condominium corporation. Common condominium property types include condo apartments and some townhouses.
Leasehold: Leasehold describes the situation where different entities own the land and the structure built on the land. Owner of the buildings has leased the land and pay rent to their landlord while owning the building on the land.
Data sourced from the Canadian Real Estate Association (CREA) and regional real estate boards. Any analysis or commentary is the opinion of the analysts at WOWA.ca and should not be construed as investment advice. Please consult a licensed real estate professional before making a real estate investment decision. The trademarks MLS®, Multiple Listing Service® and the associated logos are owned by The Canadian Real Estate Association (CREA) and identify the quality of services provided by real estate professionals who are members of CREA.