
Edmonton Housing Market Report


- The average price of a home in the Edmonton area reached an all-time high of $420,959 for March 2024, a 7.9% yearly increase and a 3.3% monthly increase.
- Benchmark prices grew 4.4% annually to reach 392.6k.
- Detached home average prices increased 6.5% year-over-year and 1.7% month-over-month to $517,131.
- Townhouse average prices increased 14% year-over-year and 2.5% month-over-month to $282,557.
- Apartment average prices increased by 0.7% year-over-year to $194,101. Apartment prices are 7% higher than last month.
- April 27, 2024 Update: Today’s Lowest mortgage rate in Edmonton is 4.74% for 5-Year Fixed.
Edmonton Housing Market Overview
Annual and Monthly Price Movement
In March 2024, the average home price reached an all-time high of $420,959, which shows a 7.9% year-over-year increase and a 3.3% month-over-month increase. Edmonton's average home price peaked at $417,465 in April 2022, then declined by 13% to a trough of $361,172 in December 2022. Since the December trough, the average home sold price in the Greater Edmonton Area (GEA) climbed 16% to reach an all-time high of $420,507 in May 2023. From May to November 2023, the average Edmonton price has been on a downward trend. Edmonton Home prices have been growing again since November 2023.
Apartment average prices increased by 0.7% year-over-year and climbed 7% month-over-month to $194,101. Townhouse average price increased 14% year-over-year and rose 2.5% month-over-month to $282,557. Semi-detached home average prices rose 12% year-over-year and increased by 6.1% month-over-month to $408,555. Detached home average prices rose 6.5% year-over-year and %1.7 month-over-month to $517,131.


The Edmonton area benchmark price of $392.6k is 2.7% higher than last month and 4.4% higher than last year. Looking at home categories in the Greater Edmonton Area, the benchmark price of single-family detached homes was $454.1k for March 2024, a 5.5% annual increase and 2.8% higher monthly. The benchmark townhouse price increased 3.1% month-over-month to $253.3k, representing a 12% yearly increase. The benchmark price for apartments was $191.2k for March 2024, a 7.9% increase year-over-year and a 4.1% monthly increase vs. February 2024.
The median residential sale price was $405,000 for March 2024, rising 1.8% relative to the previous month and rising 9.5% from last year. Looking at the median sold prices for home categories in the Edmonton area, single-family detached homes had a median sale price of $475k for March 2024, a 6.7% annual increase and a 2.2% monthly increase. The median semi-detached sold price of $400,100 represents a 9.6% yearly rise and a 3.4% monthly rise. The median townhouse sold price of $289,900 represents a 24% annual increase and a 1.7% monthly increase. Condo apartments sold with a median price of $185,625 for March 2024, increasing by 9.2% year-over-year and rising by 10.5% monthly.
Sale Numbers and State of the Edmonton Market
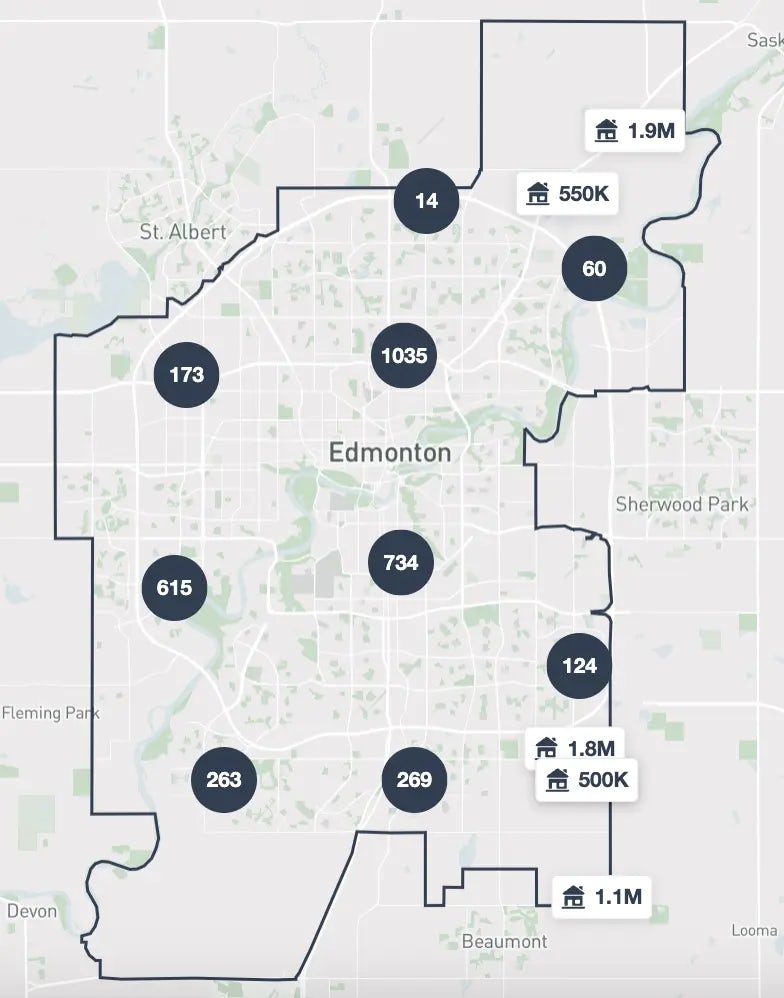
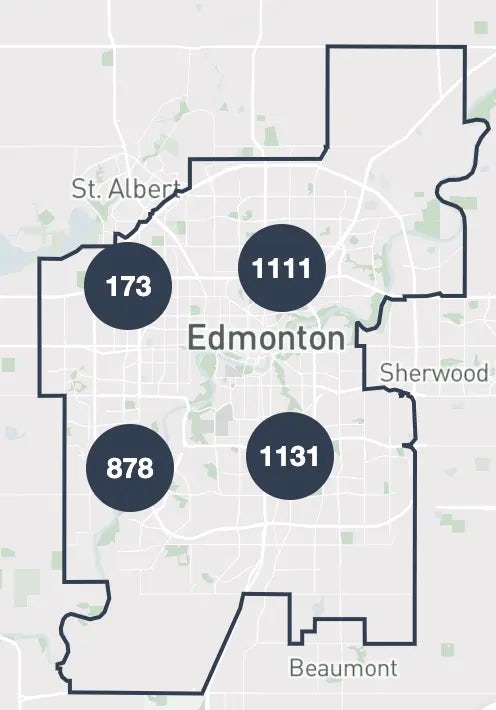
During March 2024, 2,467 residential homes, including 1,462 detached dwellings, 259 semi-detached houses, 386 apartments, and 360 townhouses, changed hands in the Greater Edmonton area.
The Edmonton area's residential sales-to-new-listings ratio (SNLR) is 69%, and residential sales to inventory is 46%. These figures suggest a seller's market in the Edmonton area during March 2024.
Edmonton Housing vs. Inflation and Other Housing Markets
Edmonton is an affordable housing market compared to other large Canadian housing markets. Interestingly, (benchmark) Edmonton house prices increased only 35% over the past 15 years, while the official inflation for this period is about 40%.
The five-year price growth of homes in Edmonton (as of February 2024), 10.5%, has been very modest compared to other major Canadian cities, most notably 45% for Toronto’s housing market, 52% for the Montreal housing market, 29% for Vancouver’s housing market, 38% for the Calgary housing market, and 53% for the Ottawa housing market. This underperformance suggests the relative absence of speculation in the Edmonton real estate market, suggesting relatively ample house supply. Given the correlation between home unaffordability and over-regulation of land use, we think Edmonton home buyers are reaping the fruit of housing freedom, especially fast approval of housing projects.
Market Analysis
Aside from supply limitations, the most important factor affecting house prices is the availability and rate of mortgages. Mortgage rates follow the expected inflation rate. High inflation elevated mortgage rates over the past two years, which pressured housing markets.
The headline inflation rate in Canada has cooled to 2.8% as of February 2024, which is a significant decline compared with 8.1% in June 2022. The unadjusted annualized 11-month inflation is 2.5%, and annualized 10-month inflation is 1.8%. These rates suggest that inflation is declining. Forward indicators like unemployment, GDP, and retail sales also suggest that inflation will decrease from this level to the Bank of Canada’s target of 2%.
Thus, the Bank of Canada’s policy rate will gradually decline over 2024 and 2025. The forecast for Canada mortgage rates, which uses market expectations, corroborates this expectation.
Home Prices in Edmonton
Greater Edmonton Area Housing Market Statistics for All Property Types in March 2024
Average Sold Price and MLS HPI Benchmark Price for GEA
Total Transactions in GEA
Market Overview for Detached Homes in March 2024
Average Sold Price
Transactions
Market Overview for Semi-Detached Homes in March 2024
Average Sold Price
Market Overview for Townhouses in March 2024
Average Sold Price
Market Overview for Condo Apartments in March 2024
Average Sold Price
Glossary and Definitions
MLS® HPI: The MLS® Home Price Index (HPI) is an index by the Canadian Real Estate Association (CREA) that tracks the prices of homes in a neighborhood. It allows Canadians to quickly compare home prices across Canada and between periods of time without having to account for specific features of a property. Unlike market prices, which can fluctuate from month to month based on seasonal dynamics, the HPI provides a stable view tracks trends across a longer period of time. The HPI is reviewed every year in May to adjust for changes in the real estate marketplace.
MLS® HPI Benchmark Price: The MLS® Home Price Index (HPI) Benchmark Price is the HPI translated into a real-world price number.
Strata Insurance: Strata insurance is insurance used by a strata like a condominium to covers damages to common areas and assets and liability to the strata. It can also include fixtures built or installed as part of the original construction of each unit, even though these may not be common structures. The insurance can cover:
- Buildings and structures associated with the strata including common areas such as the roof, parking garages, driveways, gyms, pools, etc.
- Liability for any property damage or bodily injury suffered on strata property
- Any fixtures that are part of the "standard unit" or original construction of each unit
Strata insurance does not usually include personal items and appliances that are part of a condo unit. It also does not cover the damages made by individual unit owners, such as in the case of water damage caused by a unit owner. These are usually covered by personal condo insurance.
Property types
Detached home: A detached home is your standard single-family home. It is a residential building that stands alone and is separately titled or legally a single unit.
Semi-detached home: A semi-detached home is similar to a detached home, except it shares a wall with another home. This pair of homes must make up an independent building and each should be separately titled or legally two separate units. There can only be two homes in a semi-detached building.
Townhouses: A townhouse is the middle between a detached/semi-detached home and a condo apartment. Like detached and semi-detached homes, they are often single-family units that have their own land and may be attached to other units. However, like condo apartments, they typically have to pay co-ownership fees for maintenance and may share some common features with their neighbors.
Condo apartment: This category includes all apartments and condominiums. These are complexes of residential units with common areas such as hallways, parking lots, stairwells, etc. They can be low-rise, mid-rise, or high-rise buildings. Unlike townhouses, there are no parts of the lot (the land of the building) where access is reserved for only one owner or occupant. There can be privately owned units and spaces inside the building.
Plexes are multi-story buildings with two to four individual units, usually one on each floor. They are a mainstay in Montreal and other cities in Quebec. Each unit is usually individually accessible via an external entrance with higher floors connected by staircases.
Property Classes
Freeholds: A freehold is any property where the owner owns both the house and the land it is built on. Common freehold property types include: detached, semi-detached, some townhouses, and farmland.
Condominiums: A condominium or condo is any property where the owner owns the home (or unit) but shares ownership of the land and other improvements with a condominium corporation. Common condominium property types include condo apartments and some townhouses.
Leasehold: Leasehold describes the situation where different entities own the land and the structure built on the land. Owner of the buildings has leased the land and pay rent to their landlord while owning the building on the land.
Housing Markets Across Canada


Data sourced from the RAE and the Canadian Real Estate Association (CREA). Any analysis or commentary is the opinion of the analysts at WOWA.ca and should not be construed as investment advice. Please consult a licensed real estate professional before making a real estate investment decision. The trademarks MLS®, Multiple Listing Service® and the associated logos are owned by The Canadian Real Estate Association (CREA) and identify the quality of services provided by real estate professionals who are members of CREA.