
Sales-to-New-Listings Ratio (SNLR)
Buyer’s vs. Seller’s Market


What You Should Know
- The Sales-to-New-Listings Ratio (SNLR) is used to measure the balance of supply and demand in a housing market, with higher percentages above 60% indicating a seller's market and lower percentages below 40% showing a buyer's market.
- SNLR is calculated by dividing the number of homes sold in a period by the total number of new listings added to the market, multiplied by 100 to get a percentage.
- In a buyer's market, there is an oversupply of homes relative to demand which can lead to lower home prices and increased negotiating power for buyers.
- In a seller's market, high demand and low supply lead to more buyers competing for fewer homes, increased home prices, and sellers having more control over negotiations.

Canada’s Historical Sales-to-New-Listings Ratio (SNLR) Chart
| Date | SNLR (%) | Average Home Price |
|---|---|---|
| August 2023 | 56.2% | $650,140 |
| July 2023 | 59% | $668,465 |
| June 2023 | 62.9% | $708,775 |
| May 2023 | 65.8% | $728,688 |
| April 2023 | 67.4% | $716,678 |
| March 2023 | 62.9% | $686,359 |
| February 2023 | 58.7% | $662,748 |
| January 2023 | 53.2% | $612,715 |
| December 2022 | 56.4% | $625,213 |
| November 2022 | 52.3% | $633,347 |
| October 2022 | 53.5% | $644,712 |
| September 2022 | 53.9% | $639,420 |
| August 2022 | 54.5% | $636,516 |
Page: 1
Source: Canada Real Estate Association
What is a Sales-to-New-Listings Ratio (SNLR)?
The Sales-to-New-Listings Ratio (SNLR) is a real estate market statistic that measures the relationship between the number of homes sold and the number of new listings that have been added to the market within a specific period, typically a month. SNLR is expressed as a percentage, with a higher SNLR above 60% indicating a seller's market and a lower SNLR below 40% indicating a buyer's market. When SNLR is between 40% and 60%, it’s considered to be a balanced market.
The SNLR is used because it shows the balance between supply and demand in the housing market. A high SNLR means that there are more buyers and relatively fewer sellers, as there are relatively more properties being sold than entering the market compared to a low SNLR, which leads to higher competition and often results in increased property prices. On the other hand, a low SNLR means that there are more sellers and relatively fewer buyers, resulting in lower property prices and potentially more bargaining power for buyers.
How Do You Calculate SNLR?
SNLR is calculated by dividing the number of homes sold in a specific period by the number of new listings added to the market during that same time frame. The result is then multiplied by 100 to get the percentage.
For example, if there were 2,000 homes sold and 3,000 new listings added in a month, the SNLR would be 67% ((2,000/3,000) x 100).
SNLR Formula
12-Month Moving Average SNLR
Since home sales and new listings can significantly vary from month to month, a moving average is sometimes calculated to see which direction SNLR is headed. This is called the 12-month moving average SNLR, or SNLR Trend, as it takes the average SNLR over the past 12 months. This smooths out any fluctuations and provides a clearer picture of the overall trend in the market.
For example, to calculate the 12-month moving average SNLR from this data for the month of December:
- January: 35%
- February: 40%
- March: 50%
- April: 60%
- May: 55%
- June: 50%
- July: 55%
- August: 65%
- September: 70%
- October: 60%
- November 55%
- December: 45%
Then, add the SNLR from these 12 months, then divide by 12.
12-Month SNLR Trend = ((35 + 40 + 50 + 60 + 55 + 50 + 55 + 65 + 70 + 60 + 55 + 45) / 12)
12-Month SNLR Trend = 53%
In this example, the SNLR Trend was 53%.
Buyer’s vs. Seller’s Markets
What is a Buyer’s Market?


A buyer’s market is when the SNLR is below 40%. Generally, there’s downward pressure on home prices in a buyer’s market, as there is an oversupply of homes on the market while demand from buyers is lower. This results in properties sitting on the market for longer periods and sellers having less negotiating power as they compete for potential buyers. Potential buyers also have more options to choose from, allowing them to negotiate for lower prices.
However, there are other real estate statistics to look at too. Factors such as inventory levels, average days on market, and the sale-to-list ratio also play a crucial role in determining the state of the housing market.
Can home prices still rise in a buyer’s market?
The Canada Mortgage and Housing Corporation (CMHC), a federal Crown corporation, notes that a buyer's market occurs when the sales-to-new-listings ratio is below 40%, and historically causes home prices to rise at a rate less than the overall inflation rate. This means that home prices can still increase in a buyer’s market, but historically, it has been at a rate less than inflation.
What is a Seller’s Market?
In a seller's market, there are more buyers competing for fewer homes on the market. This often leads to bidding wars and properties selling quickly at or above asking price, with sellers having the upper hand in negotiations.
A seller’s market means that sellers can be more selective with potential buyers, leading buyers to increase their offers or make offers to buy a home more attractive by dropping conditions from conditional offers. For example, in a bidding war, a buyer who is very close to their affordability limit or are confident in the quality of their chosen house might drop their home inspection condition. The CMHC notes that home prices generally rise at a rate higher than inflation during a seller’s market.
Overheated Housing Markets


An overheated housing market occurs when housing demand significantly exceeds supply, leading to rapid price increases. The CMHC generally classifies an overheated housing market as one with an SNLR over 70% for at least two out of four consecutive quarters, with the exact ratio being influenced by local factors depending on the market.
SNLR vs. Average Home Prices
SNLR can be used as an indicator of future changes in home prices. In a seller's market, where SNLR is high, there is typically upward pressure on property prices as buyers compete for a limited number of homes. In a buyer's market where SNLR is low, there may be downward pressure on property prices as sellers try to attract potential buyers.
In the chart below, the purple line represents the 1-year price percentage change, while the light blue line is the 12-month SNLR.
The green line and below represents the threshold for a buyer’s market, while the red line and above is a seller’s market.

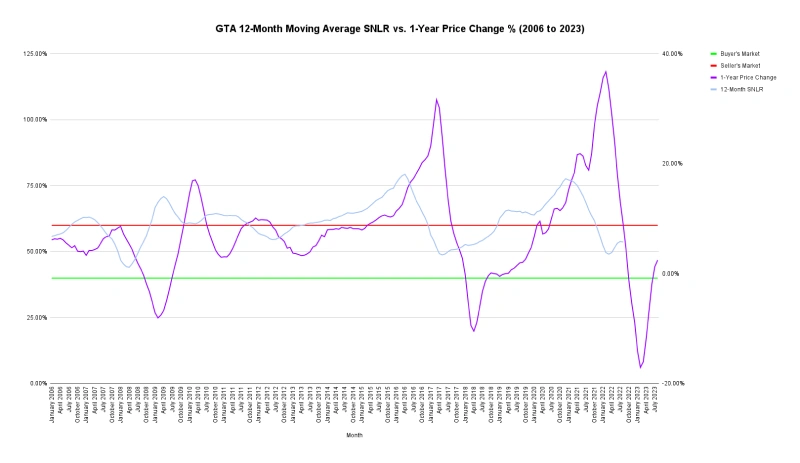
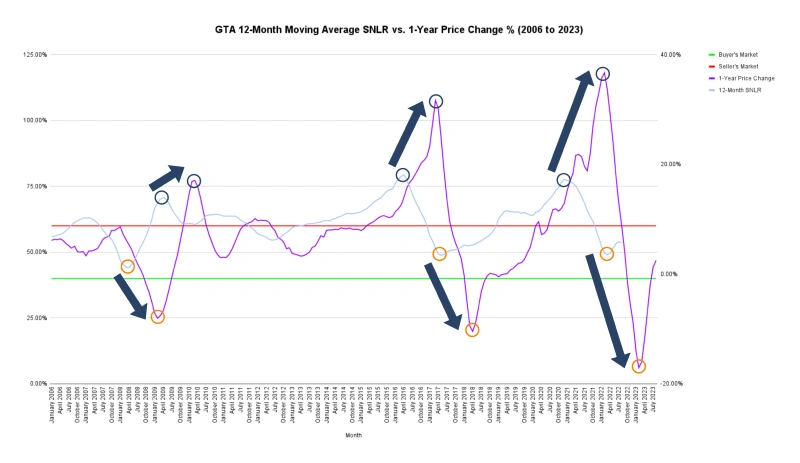
For example, in this chart that shows the Greater Toronto Area’s (GTA’s) 12-month moving average SNLR and the 12-month moving average monthly price percentage change from 2006 to 2023, we can see how the two metrics are correlated. When SNLR is high, the home price percentage change tends to increase, and when SNLR is low, price percentage change tends to decrease.
There is a slight delay, which means that we can predict what future home price changes might occur over the next few months based on the 12-month moving average SNLR. With SNLR dropping to another low in August 2023, this might bring lower prices for the final quarter of 2023.
Some markets can have predictable SNLRs based on seasonality. For example, Manitoba’s housing market consistently saw its SNLR dip into buyer’s market territory every January from 2016 to 2020, with other dips every January from 2021 to 2023. Manitoba’s housing market also consistently gets into seller’s market territory every summer, showing a busy and overheated summer season.
Manitoba Sales-to-New-Listings Ratio (2016 to 2023)
SNLR Statistics
GTA Sales-to-New-Listings Ratio (1996 to 2023)
| Date | Sales | New Listings | SNLR (%) | Monthly Price % Change |
|---|---|---|---|---|
| September 2023 | 4642 | 16258 | 28.55% | No Data Available |
| August 2023 | 5294 | 12296 | 43.05% | -1.71% |
| July 2023 | 5250 | 13712 | 38.29% | -0.86% |
| June 2023 | 7481 | 15865 | 47.15% | 0.59% |
| May 2023 | 9012 | 15194 | 59.31% | 2.22% |
| April 2023 | 7531 | 11364 | 66.27% | 2.62% |
| March 2023 | 6896 | 11184 | 61.66% | 1.9% |
| February 2023 | 4783 | 8367 | 57.17% | 1.75% |
| January 2023 | 3100 | 7688 | 40.32% | -0.07% |
| December 2022 | 3117 | 4074 | 76.51% | -0.8% |
| November 2022 | 4544 | 8880 | 51.17% | -0.76% |
| October 2022 | 4961 | 10390 | 47.75% | -1.11% |
| September 2022 | 5038 | 11237 | 44.83% | -1.2% |
Page: 1
The GTA housing market hasn’t been firmly in a buyer’s market since 2009. This is expected to change in late 2023 when the SNLR dips down below 40%.
GTA SNLR vs. Monthly Price % Change (2006 to 2023)
Overlaying the monthly price percentage change over SNLR, there’s a clear correlation between them. A higher SNLR brings higher home prices, while a lower SNLR brings lower home prices. A balanced market, between an SNLR of 40% and 60%, has a monthly price change hovering around 0%.
GTA 12-Month Moving Average SNLR (1997 to 2023)
The GTA’s 12-month moving average SNLR is at its lowest point in almost 30 years. This could push the 12-month moving average monthly price percentage change into negative territory.
GTA 12-Month Average SNLR to Monthly Price % Change (2006 to 2023)
| Date | Sales | New Listings | SNLR (%) | Monthly Price % Change |
|---|---|---|---|---|
| September 2023 | 4642 | 16258 | 51.43% | No Data Available |
| August 2023 | 5294 | 12296 | 52.79% | 0.21% |
| July 2023 | 5250 | 13712 | 53.65% | 0.11% |
| June 2023 | 7481 | 15865 | 53.86% | -0.16% |
| May 2023 | 9012 | 15194 | 53.23% | -0.57% |
| April 2023 | 7531 | 11364 | 51.54% | -0.98% |
| March 2023 | 6896 | 11184 | 49.64% | -1.34% |
| February 2023 | 4783 | 8367 | 49.06% | -1.42% |
| January 2023 | 3100 | 7688 | 49.65% | -1.17% |
| December 2022 | 3117 | 4074 | 52.18% | -0.74% |
| November 2022 | 4544 | 8880 | 55.52% | -0.45% |
| October 2022 | 4961 | 10390 | 58.74% | -0.11% |
| September 2022 | 5038 | 11237 | 61.7% | 0.36% |
Page: 1
When comparing monthly home price changes with the SNLR in Toronto’s housing market with a scatterplot, it shows that an SNLR above 60% usually results in a rise in home prices on a monthly basis, while an SNLR below 60% usually results in a decrease in home prices.
Manitoba Sales-to-New-Listings Ratio (2016 to 2023) Month Sales New Listings
| Date | Sales | New Listings | SNLR (%) |
|---|---|---|---|
| August 2023 | 1534 | 2171 | 70.66% |
| July 2023 | 1519 | 2374 | 63.98% |
| June 2023 | 1752 | 2484 | 70.53% |
| May 2023 | 1644 | 2784 | 59.05% |
| April 2023 | 1230 | 1230 | 100% |
| March 2023 | 1102 | 1958 | 56.28% |
| February 2023 | 723 | 1388 | 52.09% |
| January 2023 | 643 | 1394 | 46.13% |
| December 2022 | 609 | 753 | 80.88% |
| November 2022 | 943 | 1395 | 67.6% |
| October 2022 | 1137 | 1764 | 64.46% |
| September 2022 | 1196 | 2026 | 59.03% |
| August 2022 | 1496 | 2326 | 64.32% |
Page: 1