
Alberta Housing Market Report


- Alberta’s benchmark home price was $507,900, up9.8% year-over-year.
- Average home prices in Alberta have increasedby 0.7% in a year to$497,473
- May 9, 2024 Update: Today’s Lowest mortgage rate in Alberta is 4.74% for 5-Year Fixed.
Alberta Housing Market Overview
Alberta Housing Market as of March 2024


Alberta’s housing market is heating up. Tight inventory levels, coupled with strong demand and sales activity, are helping to push up home prices. For March 2023, Alberta’s benchmark home price of $507,900 was the highest it has ever been, and it’s also up 9.8% year-over-year.
Meanwhile, Alberta’s average home price rose 0.7% year-over-year to $497,473. That’s up 3.2% on a monthly basis.
Home sales activity is also seeing strong growth, up 18% year-over-year to 7,451 homes sold during the month of March 2024. A boom in sales across all property types drove this growth. Apartment sales in Alberta numbered 1,393, up 23% year-over-year. 685 semi-detached home sales are up 20% year-over-year, while row houses have seen 1,057 sales increasing by 24% year-over-year. Detached home sales are seeing a 15% year-over-year increase to reach 4,316.
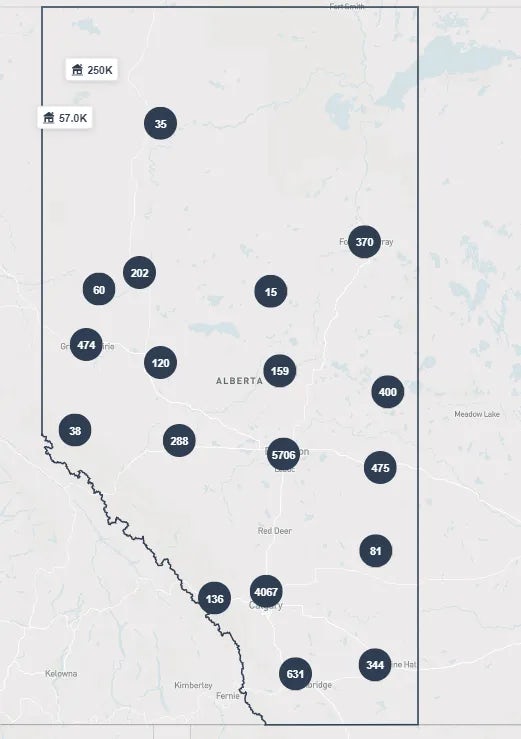
Meanwhile, the province experienced a decrease in overall housing inventory, with 13,096 units available, which is down 25% year-over-year and reduced the months of supply to 1.8, down 36% year-over-year.
Housing bubbles in Ontario and British Columbia make Alberta's housing market look healthy and affordable. When we concentrate on Alberta itself, we can see some serious affordability challenges. The home price index in Alberta has risen by over 145% over the past 19 years, while the CPI inflation has risen by 50% over this period. So Alberta home prices have risen three times faster than the general level of prices.
Alberta: Seller’s or Buyer’s Markets?
| City | March 2024 Sales-to-New-Listings Ratio | February 2024 Sales-to-New-Listings Ratio | Change | Market Type |
|---|---|---|---|---|
| Calgary | 84% | 79% | Seller's Market | |
| Edmonton | 69% | 71% | Seller's Market | |
| Red Deer | 75% | 64% | Seller's Market | |
| Lethbridge | 92% | 93% | Seller's Market | |
| Medicine Hat | 84% | 63% | Seller's Market | |
| Grand Prairie | 59% | 86% | Balanced Market | |
| Fort McMurray | 56% | 56% | Balanced Market | |
| Alberta | 74% | 72% | Seller's Market |
The provincial sales-to-new listings ratio (SNLR) was at 74%, which is in the seller’s market territory. This means that for every 100 new listings, the market absorbed 72 listings this month. This clearly indicates that demand continues to outpace supply in Alberta's housing sector.
The sales-to-new-listings ratio (SNLR) measures the level of demand vs. the level of supply in the market and can be used as an indicator of whether it is a buyer's or seller's market. A high SNLR above 60% indicates a seller's market, where there are comparatively more buyers than homes available for sale, leading to higher prices and less negotiating power for buyers. On the other hand, a low SNLR below 40% suggests a buyer's market with more homes available than interested buyers, giving buyers more negotiating power and potentially lower prices. Most of Alberta’s major cities are currently in a seller’s market, which can help push up Alberta home prices. The exceptions to this are Fort McMurray and Grande Prairie, which are in a balanced market.
Calgary's housing market iis the largest and the most expensive in Alberta, with an average home price of $596,193, up 11% annually. In other areas of the province, for the month of March 2024, Edmonton's housing market saw average prices up 7.9% annually at $420,959.
Among urban markets in Alberta, only Fort McMurray is seeing a negative year-over-year price change. Red Deer home prices are up 5% year-over-year to $351,220, Lethbridge home prices are up 8% year-over-year to $366,816, and Medicine Hat home prices are up 10% year-over-year to $330,669. The volatile Fort McMurray housing market is now seeing prices down 2% year-over-year to $350,974.
The housing supply in the province of Alberta is tightening. There were 0.95 months of supply in the City of Calgary during the month of March 2024, down 29% YOY, while Edmonton had 1.6 months of supply, down by 54% YOY. Looking at housing inventory across the province, Alberta's months of supply is down 36% year-over-year to 1.8 months. Sales are up 18% year-over-year to 7,451, while new listings are down 2% year-over-year to 10,114, and inventory is down 25% year-over-year to 13,096.
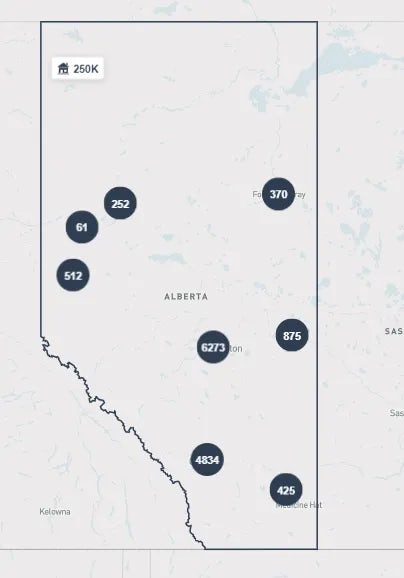
| City | Average Home Prices (March 2024) | Population (2021) |
|---|---|---|
| Calgary | 1,481,806 6.4% vs. 2016 | |
| Edmonton | 1,418,118 7.3% vs. 2016 | |
| Red Deer | 100,844 4.0% vs. 2016 | |
| Lethbridge | 123,847 5.5% vs. 2016 | |
| Medicine Hat | 76,376 -0.2% vs. 2016 | |
| Grande Prairie | 64,141 1.5% vs. 2016 | |
| Fort McMurray | 68,002 1.3% vs. 2016 |
Housing Markets of Major Cities in Alberta
Housing Markets Across Canada


Data sourced from the Alberta Real Estate Association (AREA) and the Canadian Real Estate Association (CREA). Any analysis or commentary is the opinion of the analysts at WOWA.ca and should not be construed as investment advice. Please consult a licensed real estate professional before making a real estate investment decision. The trademarks MLS®, Multiple Listing Service® and the associated logos are owned by The Canadian Real Estate Association (CREA) and identify the quality of services provided by real estate professionals who are members of CREA.