
British Columbia Housing Market Report


Average Home Prices in British Columbia for March 2024
Historical Average Home Prices in British Columbia
British Columbia Housing Market as of March 2024

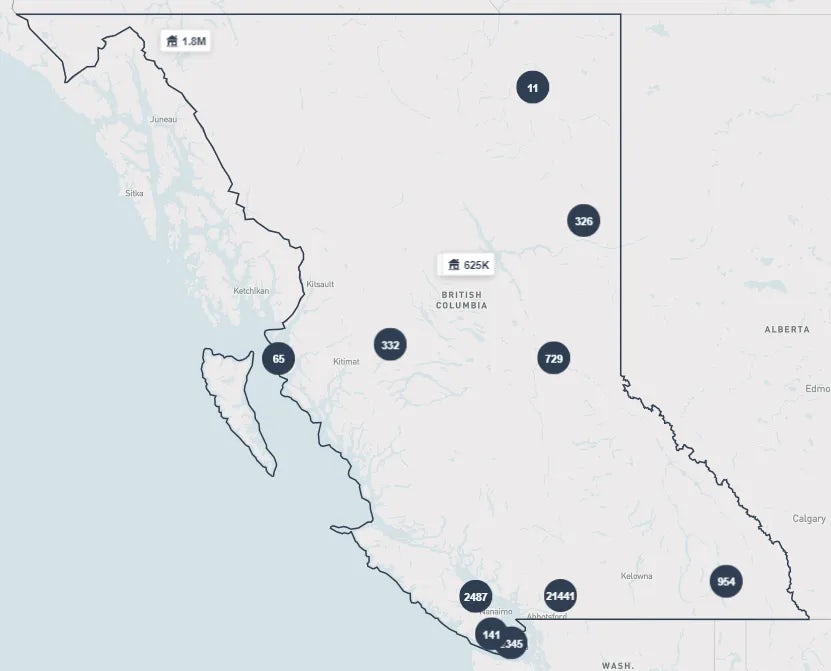

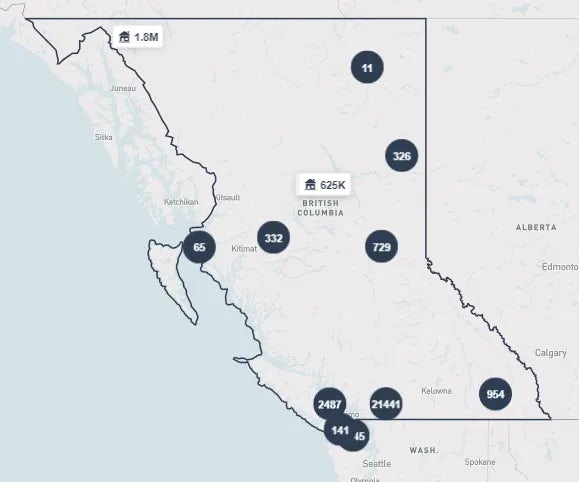
British Columbia’s average home price hit a two-year high in March 2024 after rising 3.3% on a monthly basis, while the province’s benchmark home price rose by 1.1% monthly. For March 2024, BC’s average home price was $1,020,000, the highest that it has been since April 2022, and is 6.1% higher year-over-year. Meanwhile, BC’s benchmark home price was $976,400, up 4.0% year-over-year.
There was strong growth in BC home sales in March 2024, with 6,460 homes sold across the province. That’s down 9.5% year-over-year and 18% higher than last month’s 5,497 sales in February 2024. As for active listings, there are 30,710 active listings in the province, 26% higher than last March.
British Columbia houses are extremely unaffordable. As benchmark home prices have risen by 210% over the past 19 years, while inflation has risen by 50% over the same period. So home prices have become more than tripled while the CPI basket has only grow by 1.5 times. This discrepancy is because municipal gatekeepers have limited building of houses.
The Greater Vancouver housing market had the highest average price at $1,318,687, an increase of 4.1% compared to the previous year. Fraser Valley and Victoria followed closely, with average prices standing at $1,069,696 (11% annual increase) and $992,451 (5.6% increase), respectively.
Chilliwack had an 8% year-on-year increase in prices, with the average residential price reaching $783,851. Other areas with noticeable price increases include Kootenay (12% increase to 543,986), Vancouver Island (3.4% increase to $736,595 ) and BC Northern (9% increase to $418,525).
Most areas enjoyed a rise in active listings compared to March 2023, with the Fraser Valley leading the way with a significant 40% year-over-year increase, followed by Okanagan with a 38% annual rise. Victoria also saw a substantial rise of 34% in its active listings.
Housing Markets of Major Cities in British Columbia
| City | Average Home Prices (March 2024) | Population (2021) |
|---|---|---|
| Greater Vancouver | 2,642,825 7.3% vs. 2016 | |
| Burnaby | 249,125 7.0% vs. 2016 | |
| Richmond | 209,937 5.9% vs. 2016 | |
| Coquitlam | 148,625 6.7% vs. 2016 | |
| Fraser Valley | 324,005 9.5% vs. 2016 | |
| Surrey | 568,322 9.7% vs. 2016 | |
| Abbotsford | 153,524 8.6% vs. 2016 | |
| Victoria | 91,867 7.1% vs. 2016 | |
| Chilliwack | 113,767 12.1% vs. 2016 | |
| Powell River | 17,825 6.2% vs. 2016 |
*Benchmark price, **Average benchmark price
Housing Markets Across Canada


Data sourced from the Real Estate Board of Greater Vancouver (REBGV), British Columbia Real Estate Association (BCREA) and the Canadian Real Estate Association (CREA). Any analysis or commentary is the opinion of the analysts at WOWA.ca and should not be construed as investment advice. Please consult a licensed real estate professional before making a real estate investment decision. The trademarks MLS®, Multiple Listing Service® and the associated logos are owned by The Canadian Real Estate Association (CREA) and identify the quality of services provided by real estate professionals who are members of CREA.